

v0.7.0
LLM inference in C/C++. Contribute to ggml-org/llama.cpp development by creating an account on GitHub.
llama.cpp11 min read
Stay updated with the latest developments in Artificial Intelligence
LLM inference in C/C++. Contribute to ggml-org/llama.cpp development by creating an account on GitHub.



Image Source: Wikipedia License CC-BY-SA 3.0 If you, like me, frequently commute via public transit, you may be familiar with the following situation: You arrive at the bus stop, ready to catch your bus: a line that advertises arrivals every 10 minutes. You glance at your watch and note the time...
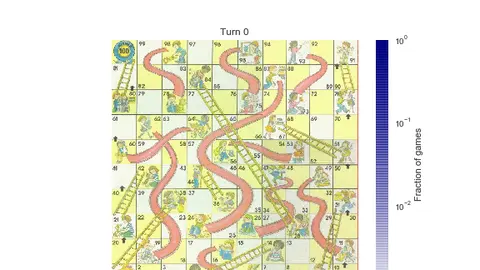
This weekend I found myself in a particularly drawn-out game of Chutes and Ladders with my four-year-old. If you've not had the pleasure of playing it, Chutes and Ladders (also sometimes known as Snakes and Ladders) is a classic kids board game wherein players roll a six-sided die to advance…
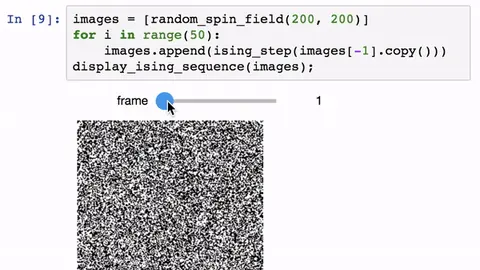
Python is quick and easy to code, but can be slow when doing intensive numerical operations. Translating code to Cython can be helpful, but in most cases requires a bit of trial and error to achieve the optimal result.
In software, it's said that all abstractions are leaky, and this is true for the Jupyter notebook as it is for any other software. I most often see this manifest itself with the following issue: I installed package X and now I can't import it in the notebook. Help!
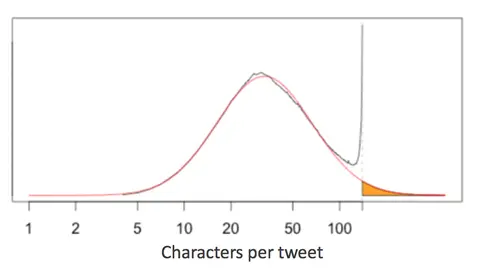
This week, Twitter upped their single-tweet character limit from 140 to 280, purportedly based on this interesting analysis of tweet lengths published on Twitter's engineering blog.
/*! * * IPython notebook * */ /* CSS font colors for translated ANSI colors. */ .ansibold { font-weight: bold; } /* use dark versions for foreground, to improve visibility */ .ansiblack { color: black; } .ansired { color: darkred; } .ansigreen { color: darkgreen; } .ansiyellow { color: #c4a000; }…
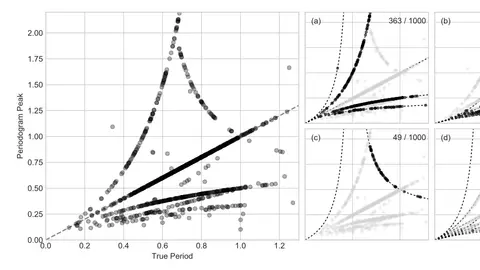
This week I published the preprint of a manuscript that started as a blog post, but quickly out-grew this medium: Understanding the Lomb-Scargle Periodogram. Figure 24 from Understanding the Lomb-Scargle Periodogram.
I've found one of the best ways to grow in my scientific coding is to spend time comparing the efficiency of various approaches to implementing particular algorithms that I find useful, in order to build an intuition of the performance of the building blocks of the scientific Python ecosystem.
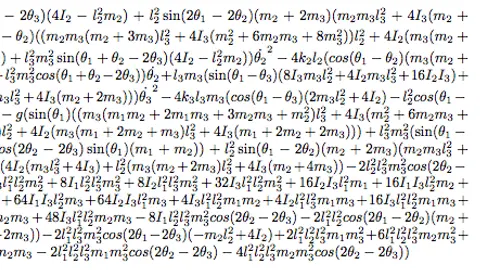
Earlier this week a tweet made the rounds which features a video that nicely demonstrates chaotic dynamical systems in action: A visualization of chaos: 41 triple pendulums with very slightly different initial conditions pic.twitter.com/CTiABFVWHW— Fermat's Library (@fermatslibrary) March 5, 2017…
Jupyter notebooks provide a useful environment for interactive exploration of data. A common question I get, though, is how you can progress from this nonlinear, interactive, trial-and-error style of exploration to a more linear and reproducible analysis based on organized, packaged, and tested…
I've spent much of the last decade using Python for my research, teaching Python tools to other scientists and developers, and developing Python tools for efficient data manipulation, scientific and statistical computation, and visualization.
This week Pronto CycleShare, Seattle's Bicycle Share system, turned one year old. To celebrate this, Pronto made available a large cache of data from the first year of operation and announced the Pronto Cycle Share's Data Challenge, which offers prizes for different categories of analysis.
In recent months, a host of new tools and packages have been announced for working with data at scale in Python. For an excellent and entertaining summary of these, I'd suggest watching Rob Story's Python Data Bikeshed talk from the 2015 PyData Seattle conference.
Last year I wrote a series of posts comparing frequentist and Bayesian approaches to various problems: In Frequentism and Bayesianism I: a Practical Introduction I gave an introduction to the main philosophical differences between frequentism and Bayesianism, and showed that for many common…
Last year I wrote a blog post examining trends in Seattle bicycling and how they relate to weather, daylight, day of the week, and other factors. Here I want to revisit the same data from a different perspective: rather than making assumptions in order to build models that might describe the data,…
An oft-repeated rule of thumb in any sort of statistical model fitting is "you can't fit a model with more parameters than data points". This idea appears to be as wide-spread as it is incorrect.
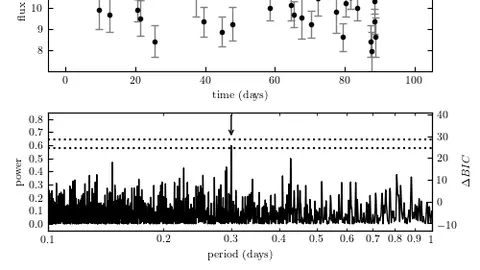
Image source: astroML. Source code here Edit, Spring 2017: For an in-depth guide to the practical use of Lomb-Scargle periodograms, see the paper discussed in A Practical Guide to the Lomb-Scargle Periodogram.
Donald Knuth famously quipped that "premature optimization is the root of all evil." The reasons are straightforward: optimized code tends to be much more difficult to read and debug than simpler implementations of the same algorithm, and optimizing too early leads to greater costs down the road.
Showing 18 of 30 stories
Load more storiesGet the top AI news and tools straight to your inbox every week.
Weekly · AI news from Python Data Science Handbook by Jake VanderPlas Blog
Join 15,000+ AI enthusiasts